.png)

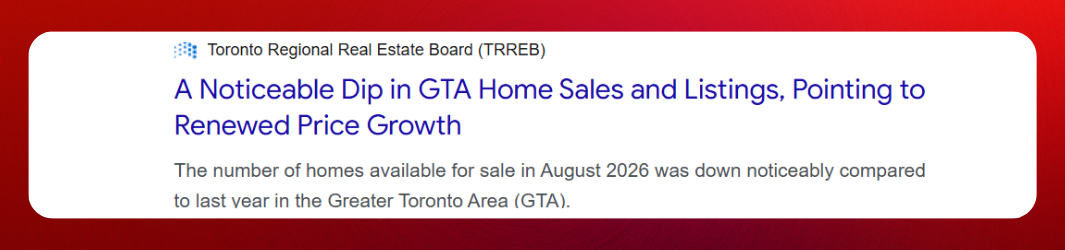
The Greater Toronto Area housing market saw fewer homes come up for sale in August, giving buyers less selection compared to the same time last year.
At the same time, home sales dipped slightly. With inventory tightening, the balance between buyers and sellers could begin to shift, potentially putting upward pressure on prices if the trend continues.
📊 August Market at a Glance
According to the Toronto Regional Real Estate Board (TRREB):
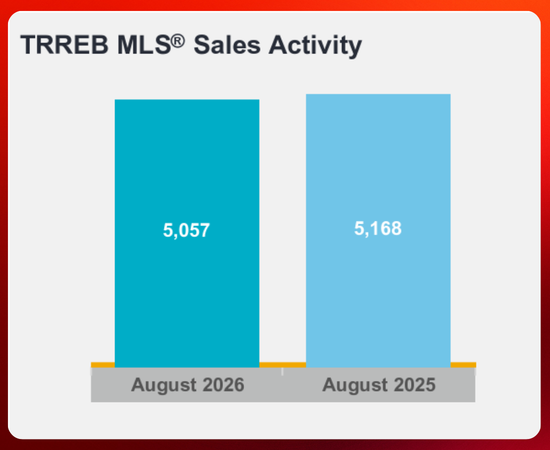
🏠 5,057 homes were sold across the GTA in August, a 2.1% decrease compared to August 2025.
📋 12,075 new listings entered the market, representing a much larger 14.1% year-over-year decline.
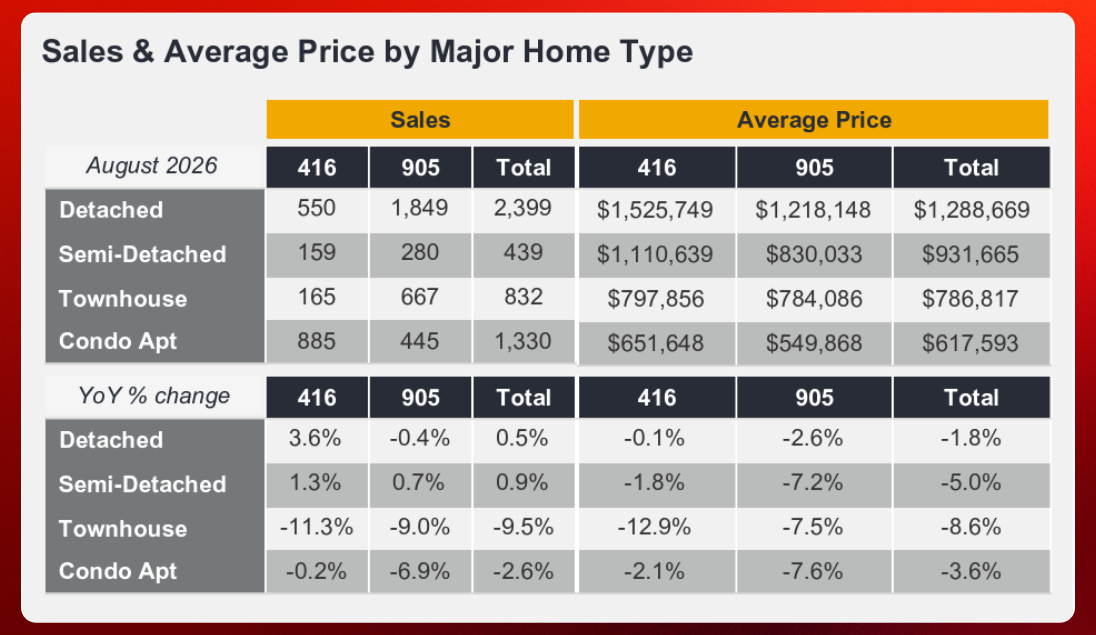
💰 The average selling price was $993,410, down 2.7% from last year.
📉 The MLS® Home Price Index Composite benchmark was 4.5% lower year-over-year.
The key takeaway is that new listings fell much faster than sales. If that continues, buyers could face more competition for the homes that are available.
🏘️ Is GTA Housing Inventory Tightening?
August's numbers suggest the amount of new inventory entering the market is shrinking compared to last year.
While sales were down 2.1%, new listings dropped 14.1%. This difference could become important if buyer demand strengthens in the coming months.
Fewer available properties can mean less negotiating power for buyers and more competition for desirable homes.
📈 What Happened to Home Prices?
Prices remained below last year's levels, but there were signs of stabilization from July to August.
On a seasonally adjusted month-over-month basis, the MLS® HPI Composite benchmark was essentially unchanged from July.
Meanwhile, the average selling price increased slightly compared to the previous month.
This doesn't necessarily mean prices are beginning a sustained climb, but it does suggest the market may be finding some stability after previous declines.
🔑 What Could This Mean for Buyers?
For buyers, the current market presents an interesting trade-off.
Waiting could provide more clarity around the economy, inflation, mortgage rates, and Canada's trade relationship with the United States.
However, if listings continue to decline while demand improves, buyers could eventually face more competition and potentially higher prices.
Those actively looking for a home may want to pay close attention to inventory levels in the specific neighbourhoods they're considering, as conditions can vary significantly across the GTA.
🏷️ What Could This Mean for Sellers?
A tighter market could gradually improve conditions for sellers.
With fewer new listings compared to last year, well-priced homes in desirable areas may face less competition from other properties.
If buyer activity strengthens while inventory remains limited, sellers could potentially benefit from stronger demand.
However, pricing appropriately remains important. GTA prices are still below their levels from a year ago, so market conditions have not shifted entirely in sellers' favour.
🇨🇦 The Bigger Picture
Affordability and economic uncertainty continue to influence the GTA real estate market.
Home prices have softened over the past year, while mortgage rates have remained relatively stable. At the same time, concerns surrounding Canada-U.S. trade, inflation, borrowing costs, and the broader economy continue to affect buyer confidence.
Beyond short-term market conditions, housing supply remains a major issue across Ontario. Zoning restrictions, taxes, development charges, and lengthy approval processes can all influence how quickly new housing is built and how much it ultimately costs.
🔎 Bottom Line
August's GTA housing numbers tell two different stories.
Sales slowed slightly, but new listings fell much more sharply.
For now, prices remain below last year's levels. But if the supply of homes continues to tighten and buyer demand picks up, competition could increase and put renewed pressure on prices.
For buyers and sellers, keeping an eye on both inventory and demand will be important as the GTA heads into the fall market.
Source: The information, market statistics, and charts featured in this article are based on data published by the Toronto Regional Real Estate Board (TRREB) for August 2026. This article has been summarized and simplified for informational purposes.
